
Chart
Each month shows two bars: Sales (billed revenue for that month) and Payment (amount actually collected in that month). Reading them side by side across a date range makes it easy to spot months where billing outpaced collections, or vice versa.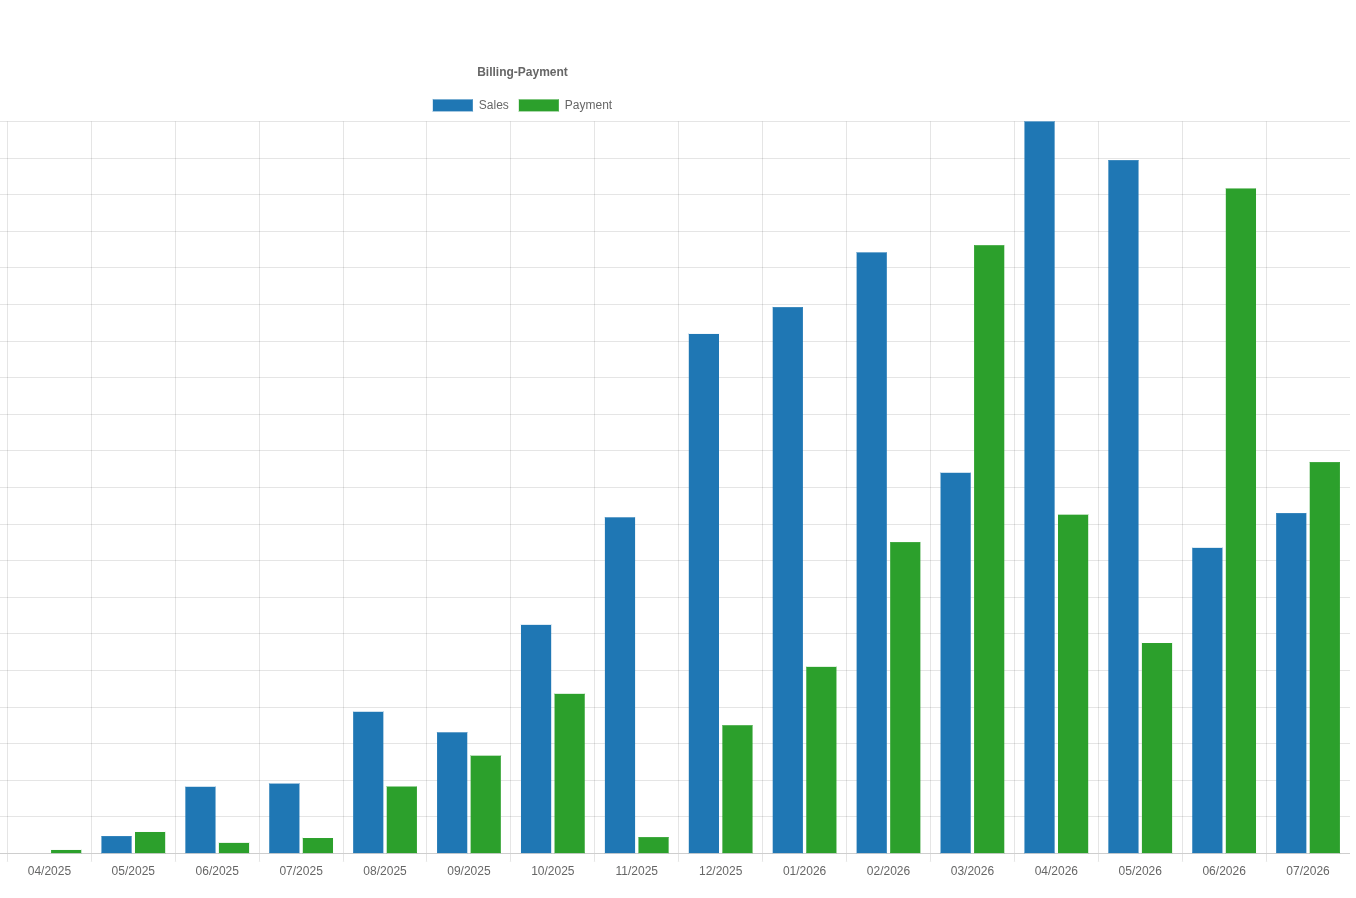
Sales vs. Payment, by month
Drilling into a bar
Clicking either bar for a given month opens a Details panel below the chart, with the underlying bill-level records for that month. Below the chart on the same Billing tab, the AR Aging Report shows outstanding balances by customer and aging bucket.- Clicking a Sales bar filters the Details panel to Report Type: Term.
- Clicking a Payment bar filters the Details panel to Report Type: Payment.
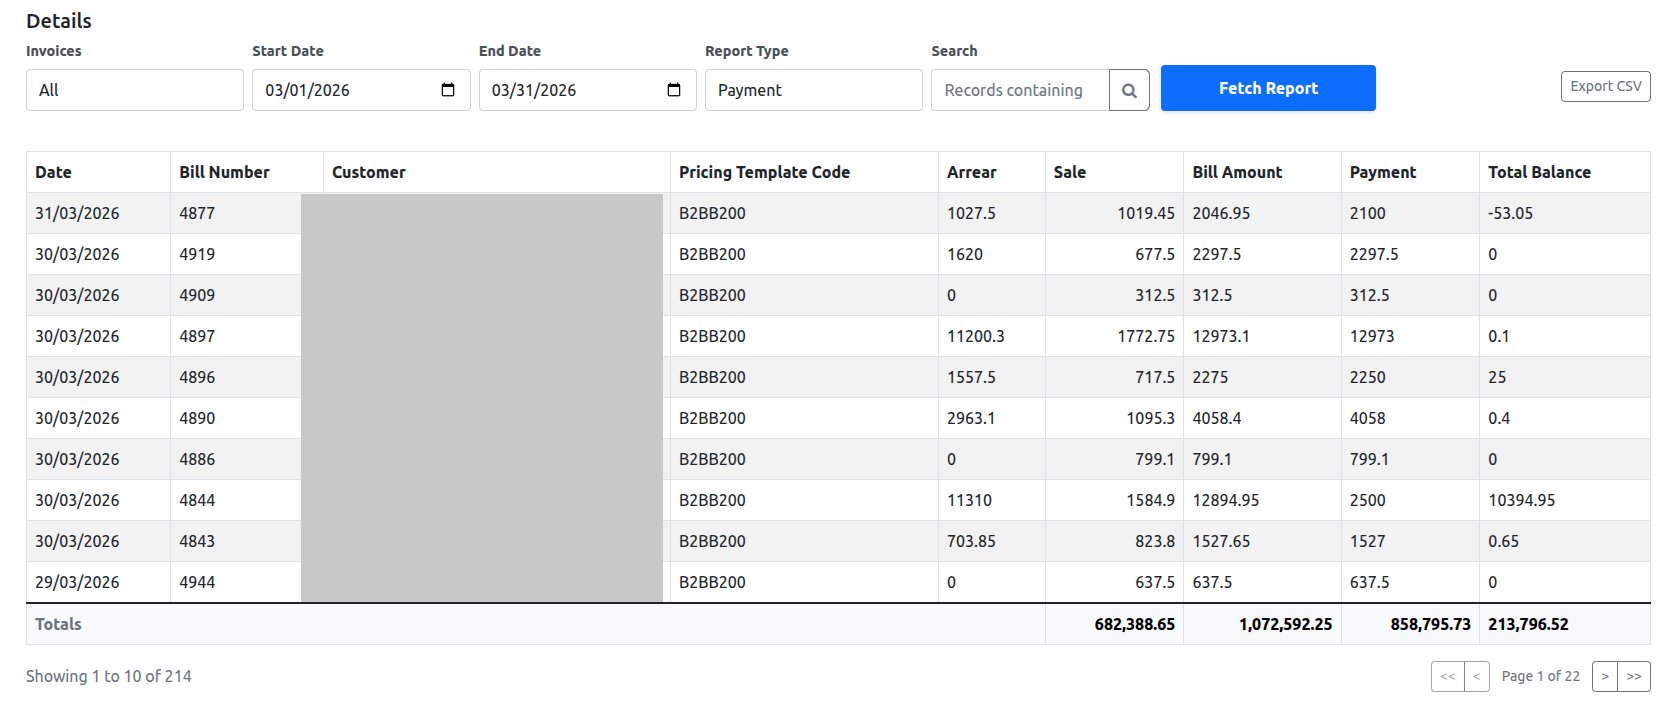
Details panel filtered to Report Type: Payment
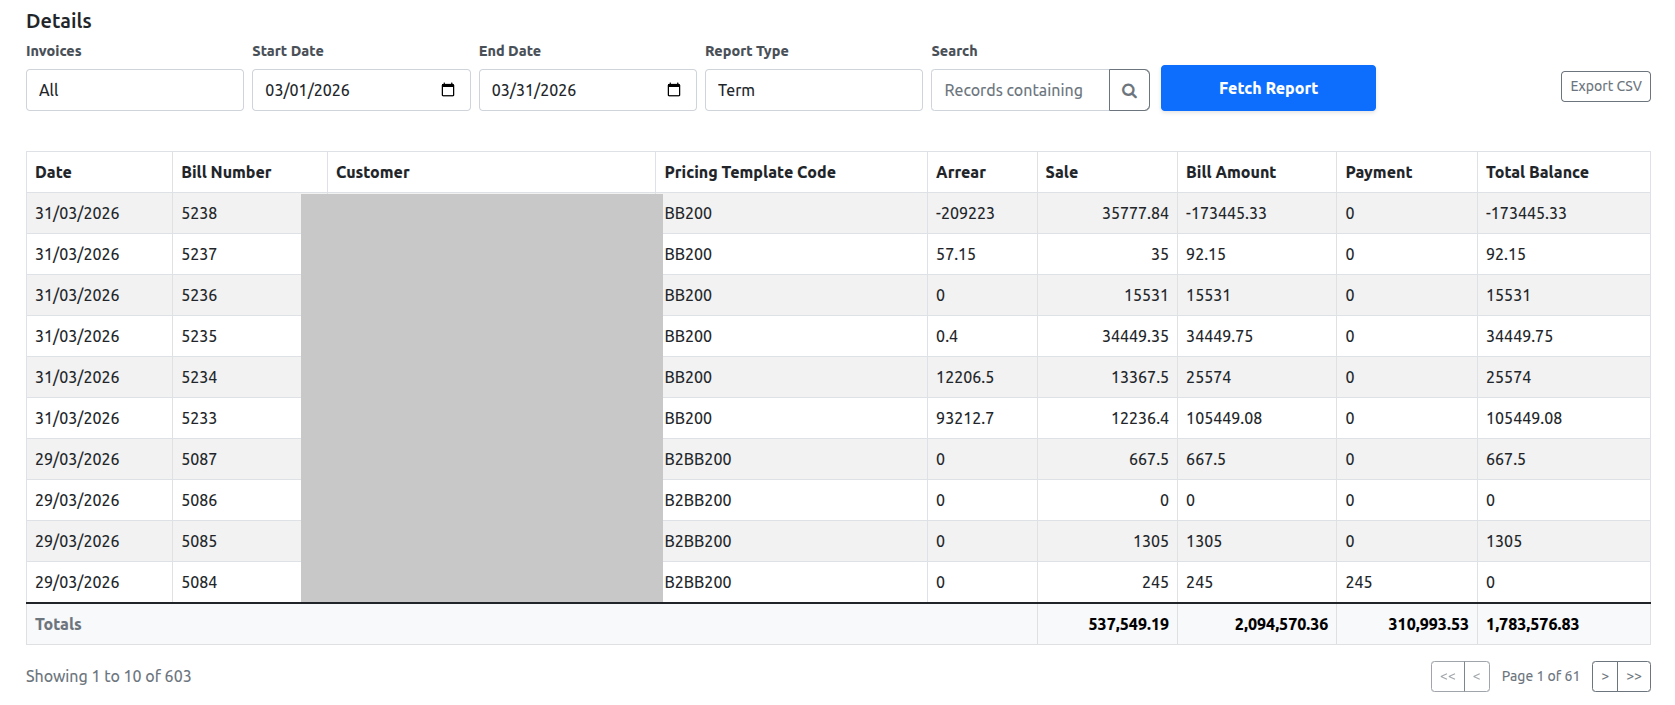
Details panel filtered to Report Type: Term
A Totals row at the bottom sums Sale, Bill Amount, Payment, and Total Balance across every record matching the current filters — not just the 10 shown on the current page.
Exporting
Export CSV downloads the full filtered result set (all pages, not just the visible 10 rows) as a spreadsheet with the same columns as the Details table.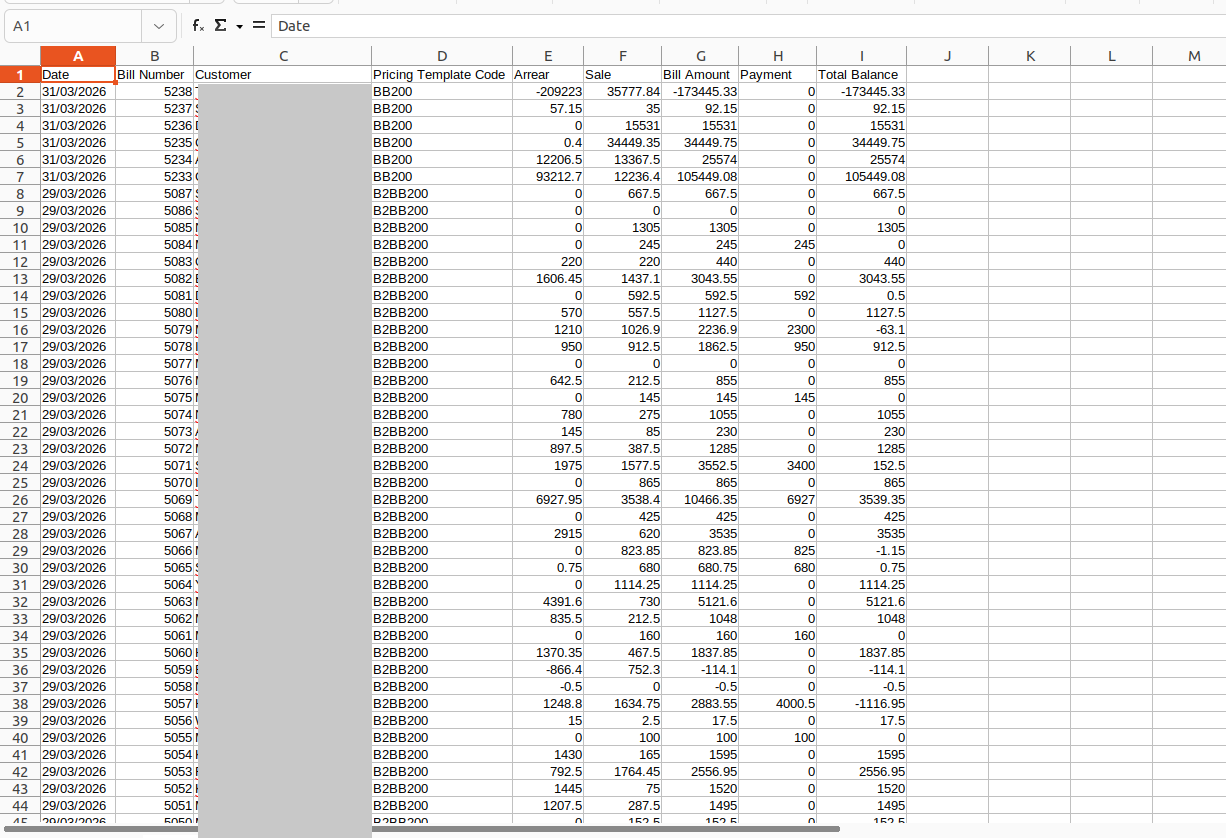
CSV export of the Details table