> ## Documentation Index
> Fetch the complete documentation index at: https://docs.techfootintl.com/llms.txt
> Use this file to discover all available pages before exploring further.
# Usage Report per Subscription
> Usage history for a single subscription across billing periods.
Usage history for a single subscription across billing periods.
This is the **Subscription Based** view of the Usage report — the counterpart to [Usage Report per Bill Run](/billing/reports/usage-report-per-bill-run), which looks at one Term across many subscriptions. This view instead looks across all Terms for a given **Package (Pricing Template)**, one subscription at a time.
## Usage Summary (By Subscription)
Select a **Package (Pricing Template)** and click **Fetch Report** to get a per-Meter-Component rollup across every subscription's full history:
| Column | Description |
| :-------------- | :------------------------------------------------------------------------------------------------- |
| Meter Component | The metered or unmetered usage type (e.g., KWH, Swaps, Distance, Operational Days, MaintenanceKms) |
| Total Usage | Sum of that component's usage across every subscription and every Term |
| Min Usage | Lowest single usage value recorded for that component |
| Avg Usage | Average usage value for that component |
| Max Usage | Highest single usage value recorded for that component |
## Usage Details
A per-subscription breakdown, with **Min / Max / Avg** for each Meter Component (rather than a single Term's reading, since this spans every Term the subscription has been billed for):
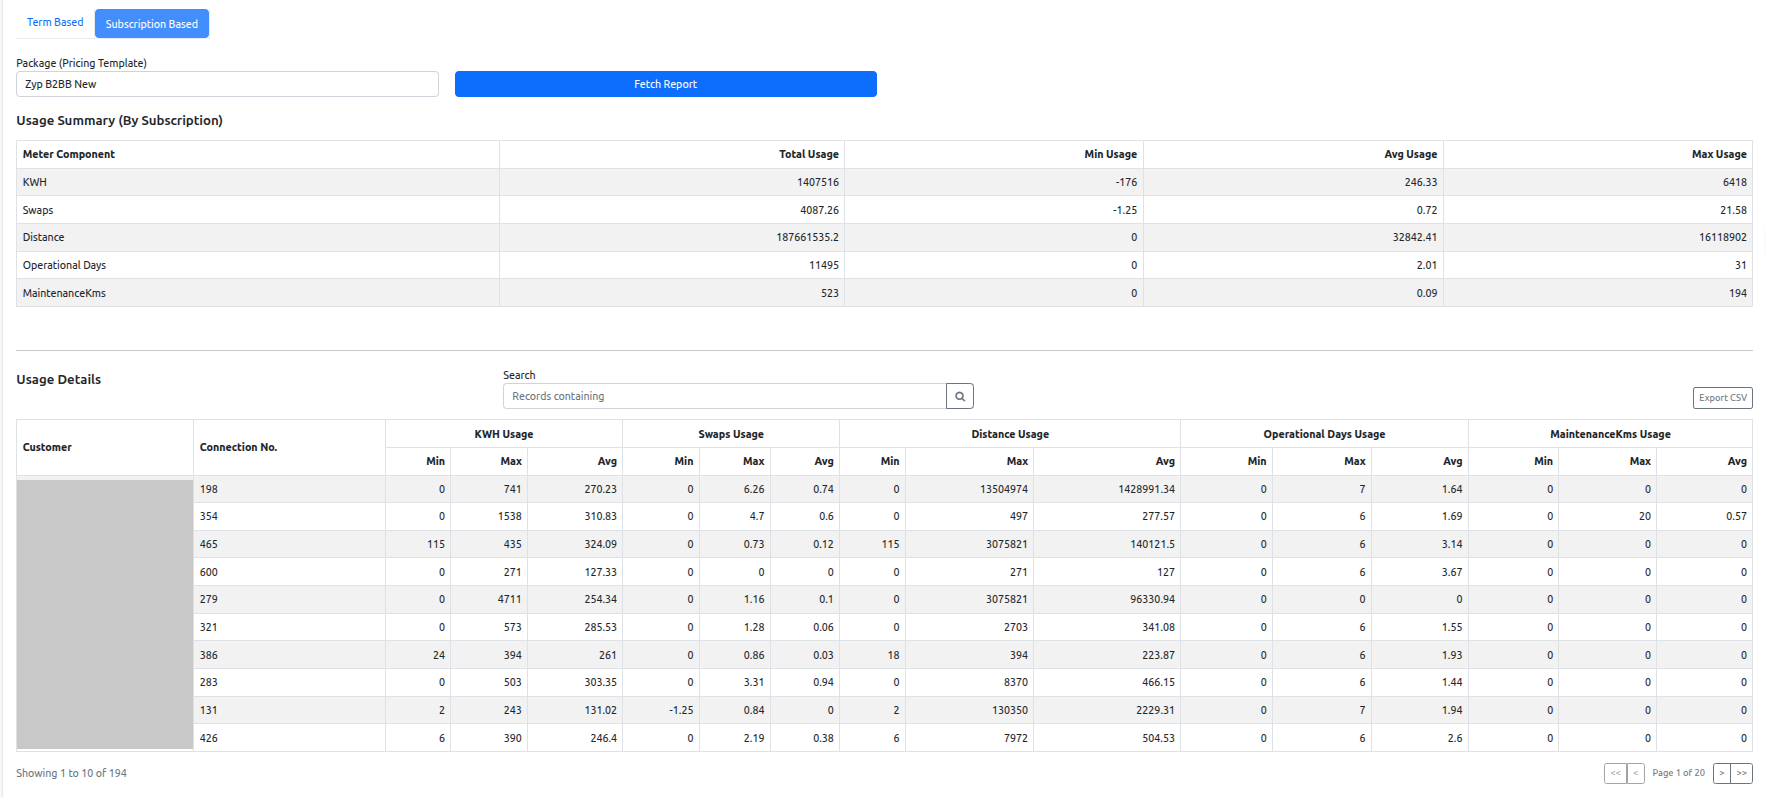 | Column | Description |
| :-------------------------------------- | :------------------------------------------------------------------------------ |
| Customer | Customer the subscription belongs to |
| Connection No. | Subscription's connection number |
| *(Min / Max / Avg per Meter Component)* | That subscription's usage range and average for the component, across all Terms |
A **Search** box filters records, and **Export CSV** downloads the full filtered result set (all pages) with the same columns.
## Drilling into a single subscription
Clicking a subscription's row opens its individual usage detail — the meters attached to that subscription (Active and Inactive, with Type, Category, and Status), plus a consumption trend chart per meter across billing periods.
| Column | Description |
| :-------------------------------------- | :------------------------------------------------------------------------------ |
| Customer | Customer the subscription belongs to |
| Connection No. | Subscription's connection number |
| *(Min / Max / Avg per Meter Component)* | That subscription's usage range and average for the component, across all Terms |
A **Search** box filters records, and **Export CSV** downloads the full filtered result set (all pages) with the same columns.
## Drilling into a single subscription
Clicking a subscription's row opens its individual usage detail — the meters attached to that subscription (Active and Inactive, with Type, Category, and Status), plus a consumption trend chart per meter across billing periods.
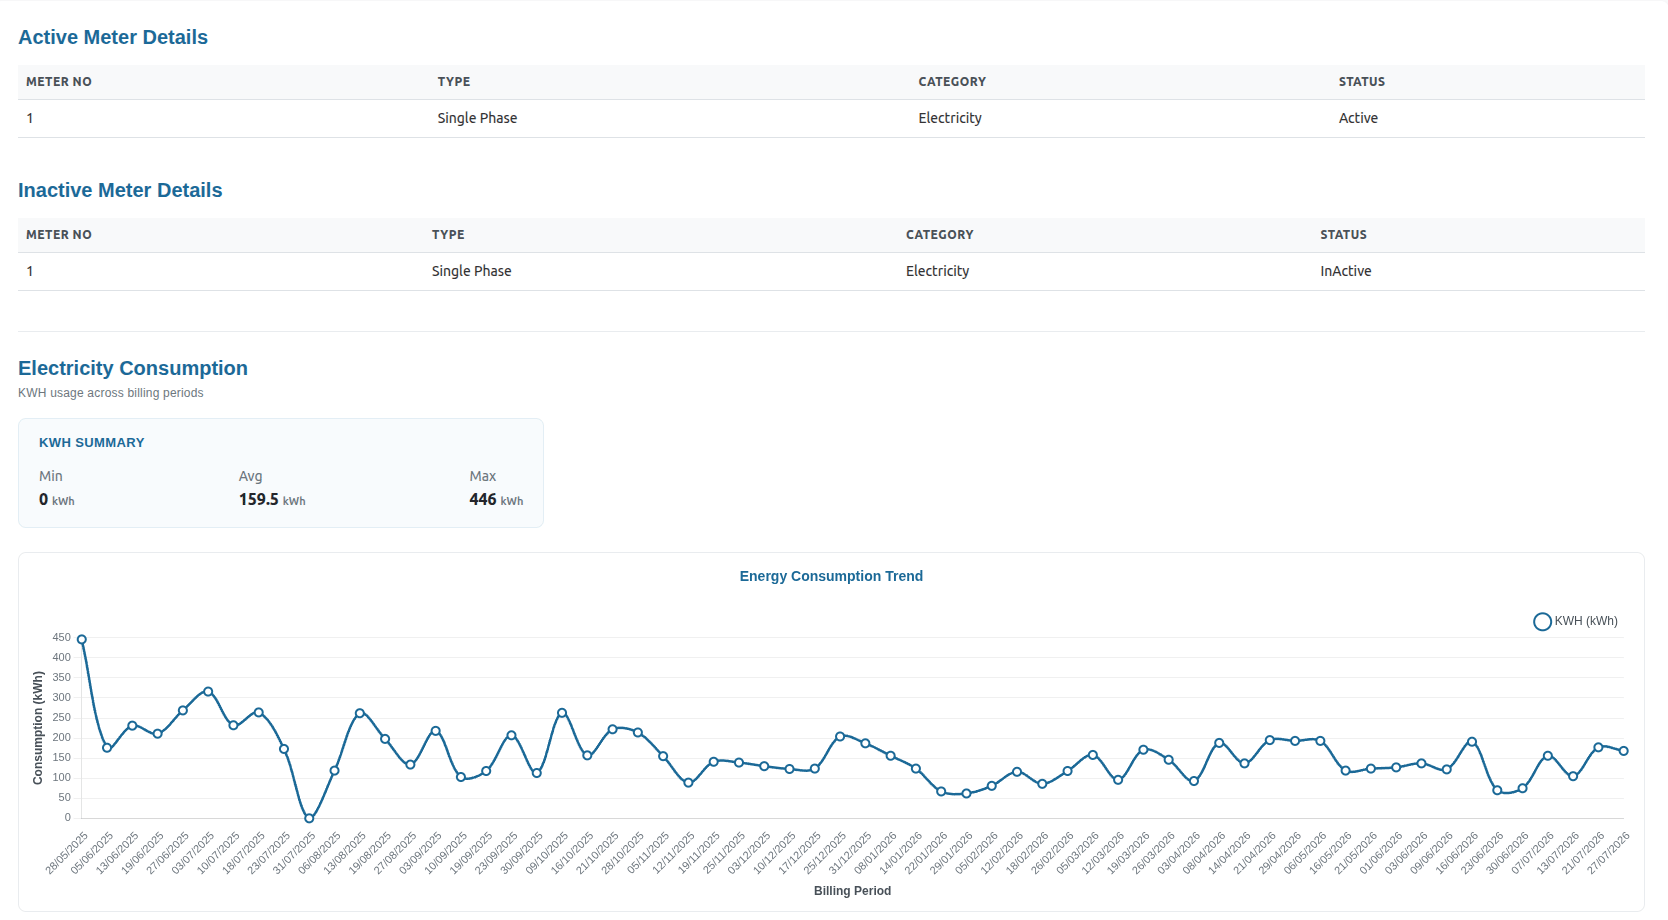 The summary card (e.g., **KWH Summary**: Min / Avg / Max) covers the same range as the trend chart below it, letting you see at a glance whether a spike or drop in the chart is within the subscription's normal range or not.